The most commonly cited standard [for walking distance to transit] is 400m or 1/4 mile
Jarrett Walker, Human Transit
What is public transit’s first-mile/last-mile (FM/LM) problem?
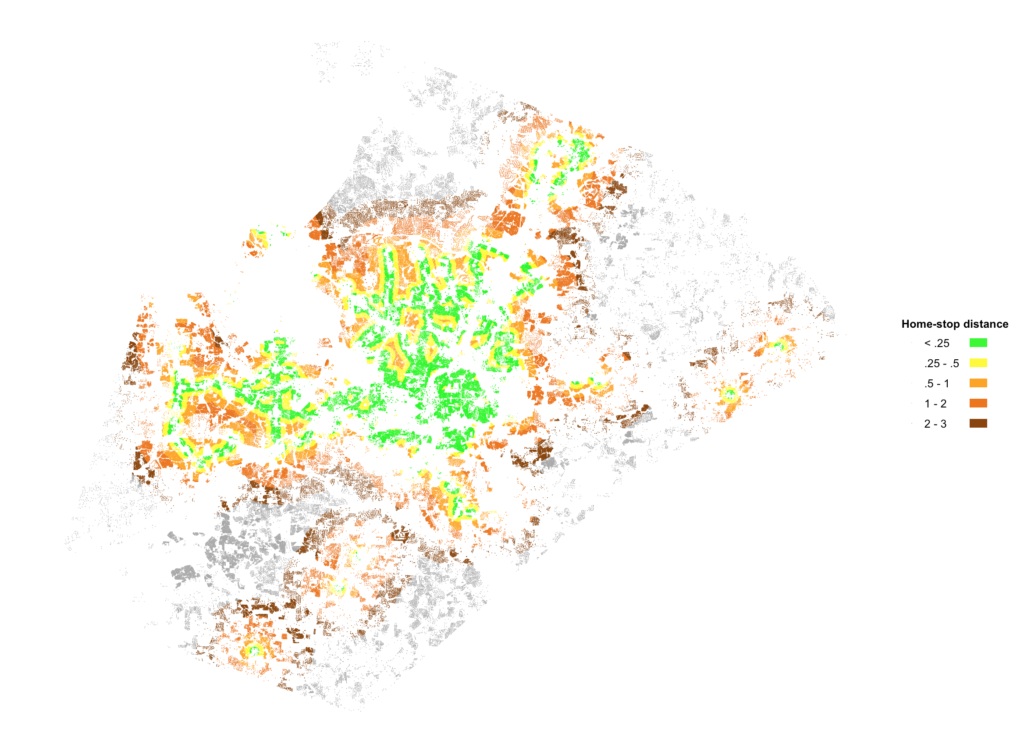
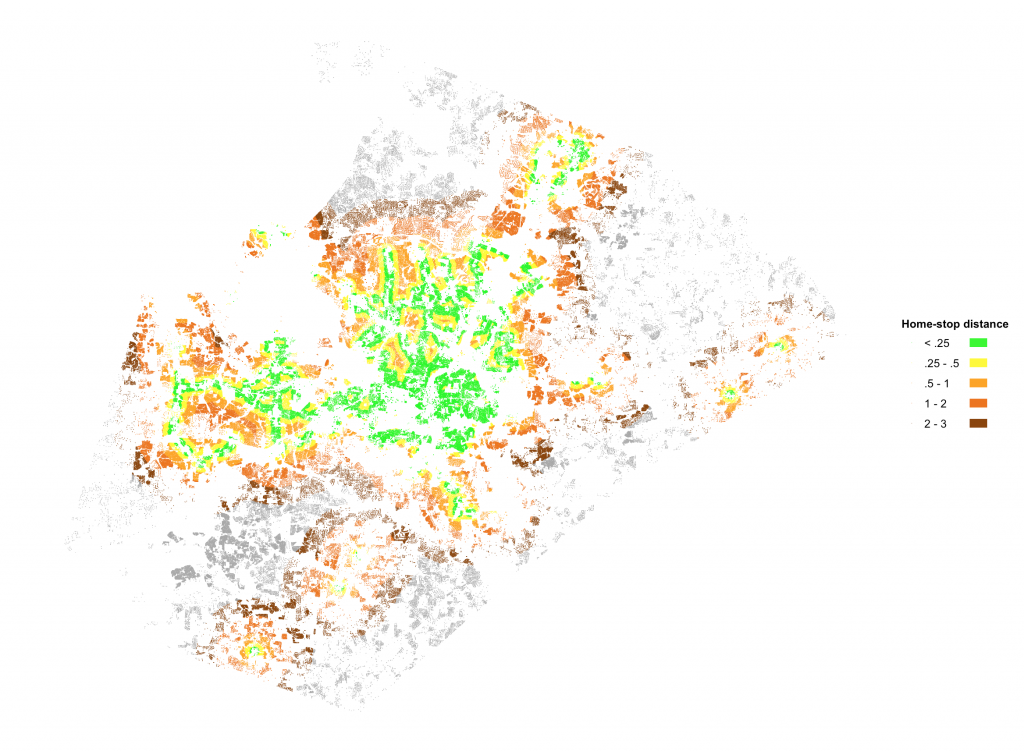
It begins with a ¼ mile. Most people in the United States are “comfortable” walking less than a ¼ mile to or from public transit stops. The problem arises when a potential rider is further than a “comfortable distance” to the necessary fixed-route stop. Of course, what you define as a “comfortable distance” may be very different than what I consider to be a “comfortable distance,” and this distance may vary based on uncontrollable variables such as weather and time of day.
In Wake County, NC, 28% of the roughly 1 million citizens live within ¼ mile of an existing mass transit stop. If the above logic holds, this means that 72% of the county’s residents are forced to walk more than the generally-accepted “comfortable distance” to transit. This is just one side of the equation—the rider’s destination must also be within ¼ mile of public transit to make it a viable option. Another way to look at this is to say that the transit agencies in Wake County have effectively eliminated 72% of their possible customer pool.
This is an inevitable side effect of a fixed-route transit system: stops are set at predetermined locations to maximize efficiency, ease-of-planning and ease-of-operation. What’s easiest for the agency is not what maximizes utility for the rider.
How do we address the First Mile/Last Mile problem?
Transit providers have three options to address the problem:
- Shift to a more user-friendly transit system entirely (such as true, point-to-point, demand-response service). This requires some massive shifts in service delivery, planning, and operations, not to mention the obvious cost increases. This may not be feasible for all providers.
- Develop a combined service model that leverages technology to supplement fixed-route service with demand-response options for riders. This combined solution provides a path to address the FM/LM problem while maintaining the benefits of fixed-route options.
- Do nothing. This is obviously suboptimal, and for agencies that don’t address the problem, ridership will likely continue to decline while riders are left without access to the transportation they rely on.
At TransLoc, we’ve developed Planning & Design services to provide custom transit solutions developed by certified transit planners. These custom solutions can include comprehensive service analysis and route design that can be flexibly deployed and monitored for constant optimization across fixed-route and on-demand services.
Imagine opening a mobile app, telling it where you would like to go, and allowing it to facilitate the entire trip. A vehicle arrives at your location, not ¼ mile away at an existing fixed-route transit stop, and takes you to the best fixed-route stop that will fit your trip needs. Your arrival at the fixed-route stop is timed perfectly with the arrival of the bus—no more waiting on the side of the road. You hop on the bus, and are taken the majority of the way on the cheapest possible option: existing fixed-route public transit. At the appropriate time, the app buzzes, letting you know it’s time to exit the vehicle where, if necessary, another vehicle is waiting to take you the rest of the way.
How would a unified service model work?
It’s at this point when public transit agency folks might be tempted to use words like “impossible” and “operationally complex” and “too expensive for our agency.” But, would it be impossible to believe that eliminating the FM/LM problem could be done with little-to-no change to existing fixed-route operations. It’s important to remember that supplementary on-demand services can be offered alongside fixed-route service, and can be rolled out at any pace, in high-priority areas first. You can also simulate microtransit services to predict the impact and cost of such an approach across a variety of scenarios. The risk really is low.
As far as your fixed route operations are concerned, operators still head to the yard every morning, get their vehicle assignments, and go about driving on the existing fixed-route schedule. Dispatchers are still available for driver- and rider-related questions. Administrators are still managing the operations on a daily basis.
Our system uses a series of algorithms to determine the most optimal trip (that includes public transit) and handles the heavy-lifting of scheduling the FM/LM ride, handles the payment, and helps the rider navigate the system.
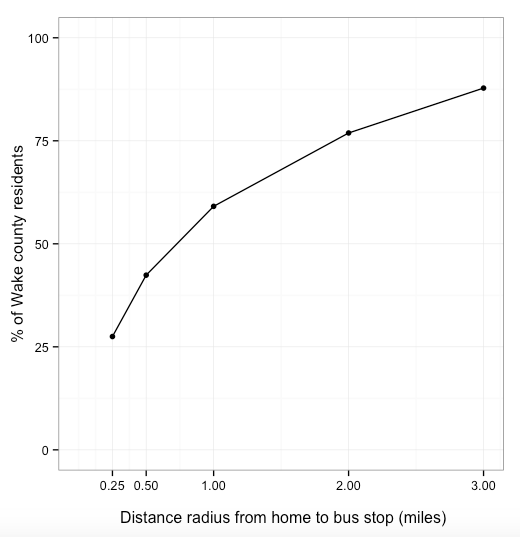
 To bring this full circle (and illustrate just what a big deal this really is), let’s go back for a minute to the Wake County data with which we started. Remember: only 28% of Wake County’s ~1 million residents live within ¼ mile of a fixed-route transit stop. If we expand that radius to 3 miles (not coincidentally, a distance you can travel for $5.00 on Uber), the number jumps to 88%.
In terms of raw humans, that expands the reach of public transit in Wake County by 600,000 people—we’ve effectively tripled the population coverage of public transit without the agencies needing to make any changes whatsoever.